![]()
Links: [Download] [Sourceforge project page]
SNMPGraph is a simple graphing tool for SNMP. It is meant to be simple, not powerfull.
It requires:
The webinterface uses Walt A. Boring IV's great phphtmllib class library for PHP. (but you dont need to download it)
SNMPGraph is not finished yet, but works quit fine for me. Thats why I
declare it to "alpha" status. As it does not perform critical operations it should be save to use it.
I will add more features soon and make the installation more userfriendly.
There is a global configuration file (/etc/snmpgraph.conf). It contains the
basic configuration parameters and some defaults.
Then in addition for each graph you like to display you need to define a
"sensor"-configfile. Each of these files go to one directory.
In such file you can specify for example:
The update.pl script looks for all sensor files, fetches new values from SNMP and updates the rrd database. Then it terminates. So you should call this script periodically (by cron?).
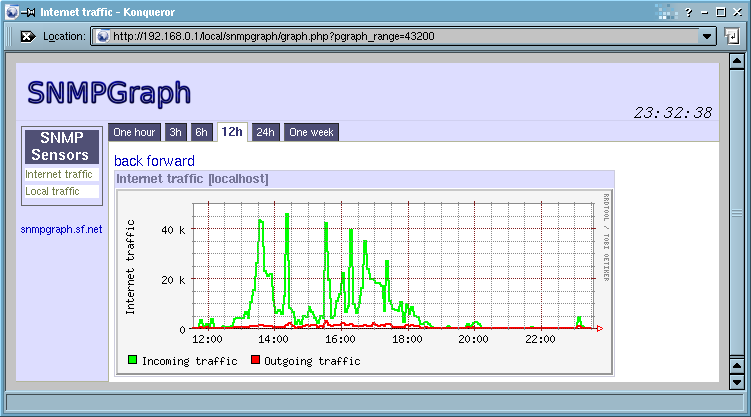
The webinterface will also look for the the sensor files and display each of them in the main menu. So if you click on one, you will get the graph. Then you can also change the resolution of the graph and scroll back and forwards in time.
Thats it... basically.
Feel free to contact me for comments and suggestions!
Martin Boese
boesemar (at) users (dot) sourceforge (dot) net